I am a graduate of Geography from the University of Gdańsk with a specialization in Meteorology and Climatology. Somewhere between graduation and today I also obtained a PhD in Earth Sciences.
For over 20 years I have been developing my data analysis skills both as an academic teacher and as an employee of a research institute. I have prepared and conducted many university courses, including: statistics, statistical inference and visualization of research results. I have also conducted workshops on the practical use of R in data analysis.
I am convinced that the skills I have acquired
in subsequent stages of my professional career and which I would like to share will allow you to develop comprehensively in the field of datascience.
Our mission
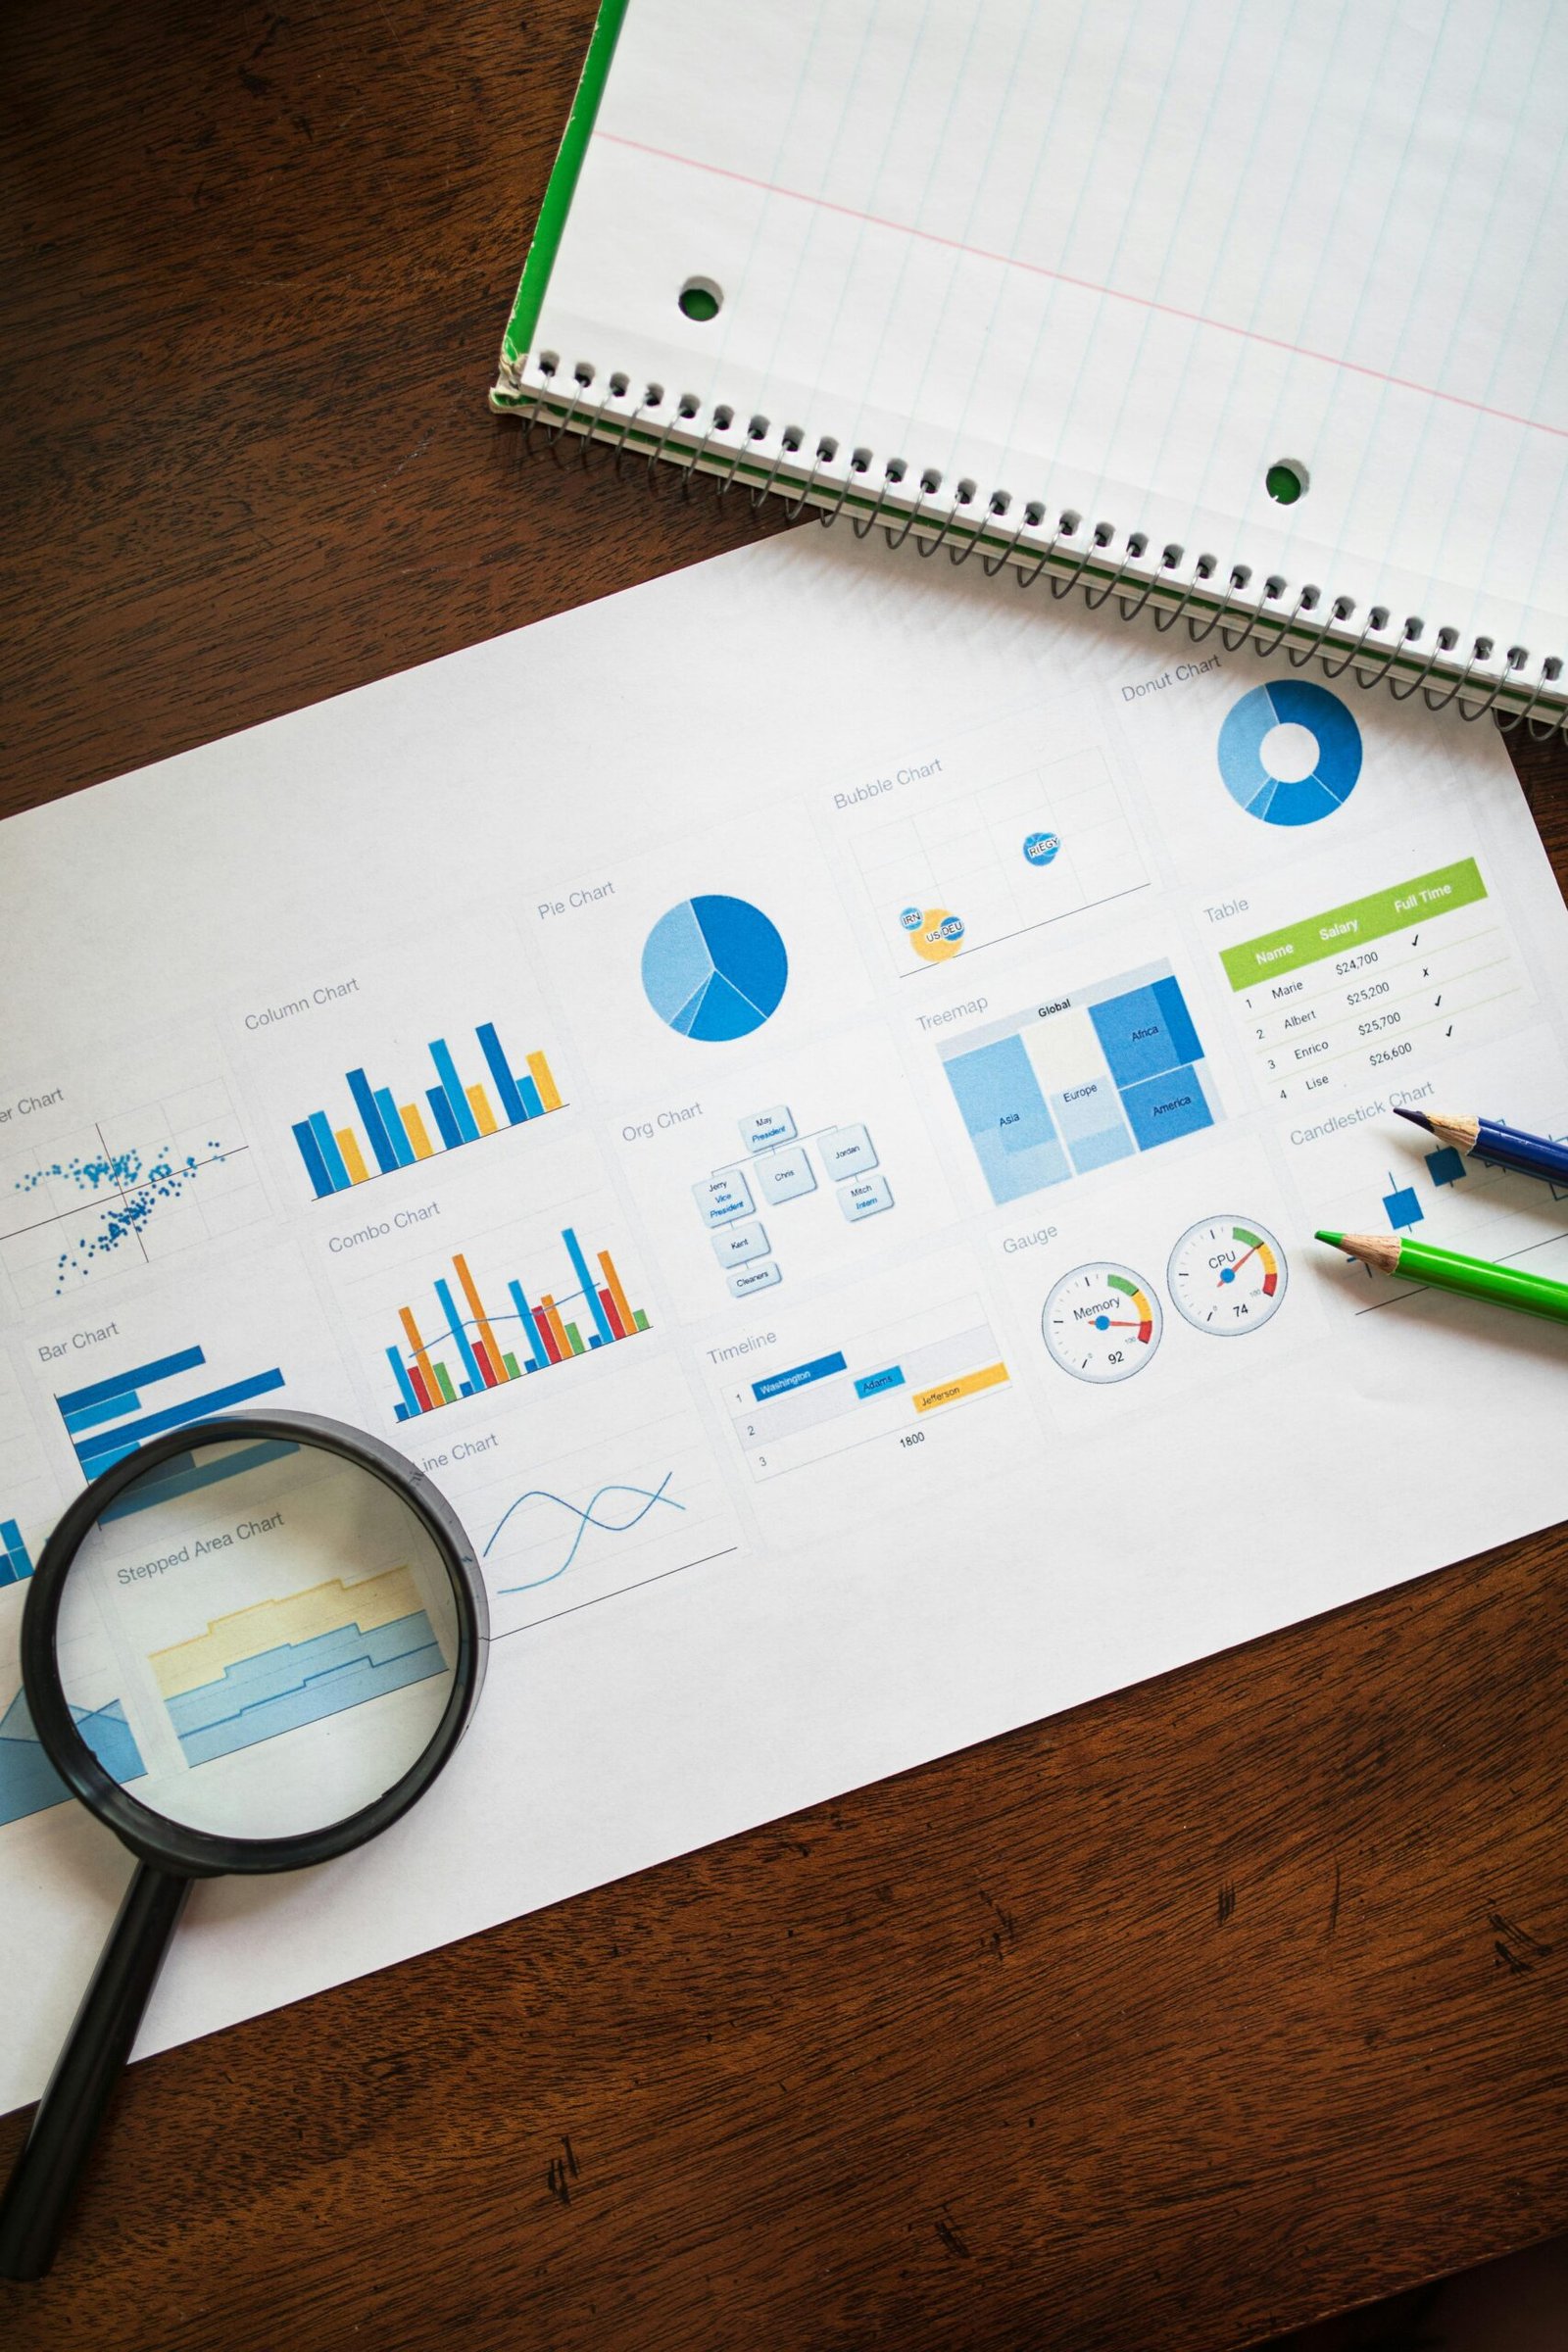
Valid statistical analysis of data and, perhaps more importantly in the current era of information overload, effective and impressive visualization of data and research results are the basic tools that allow us to learn about and understand the reality around us.
The availability of tools that allow for the quick analysis of even large amounts of data allows anyone to master this art.
This is precisely the goal that guides us at DataCraft LAB.
To enable every interested person to develop competences in the practical application of R and R Studio software in data analysis and visualization of research results.
To sum up...
Learn how to code – programming in R combined with data analysis is easier and more attractive than it seems.
Thanks to this, save time and drink coffee, or something stronger, e.g. two coffees.
Drinking coffee increases creativity and combining this feature with additional time inevitably causes an influx of new ideas,
thanks to which you will get a real chance to carry out tasks that have the greatest impact on your development.
Learn how to quickly process data, prepare professional charts, and automate reporting processes.